


Introduction
On a decentralised exchange, buyer and seller do not trade with each other. The other side of every trade is a "pool": capital that a number of people have put together so that others can swap against it and pay a fee in return. Whoever puts money in the pool takes a share of that fee. But the pool with the best income this month is not necessarily the same one next month: traders move on, fresh capital arrives and each person's share shrinks. Most capital stays where it sat on the first day.
We decided to move capital along with the opportunity, and to weigh every move against the market's own data before making it.
The DeFi LP project has gathered the full history of 136 pools on four blockchain networks, from each pool's first day until today, at the level of every single event. From that data we simulate capital sitting in a pool, and moving between pools, inside a close reconstruction of the market itself, and we have checked the result against real money. The destination is an automated fund that manages money and moves it between pools, toward the best net return.
Inside the platform
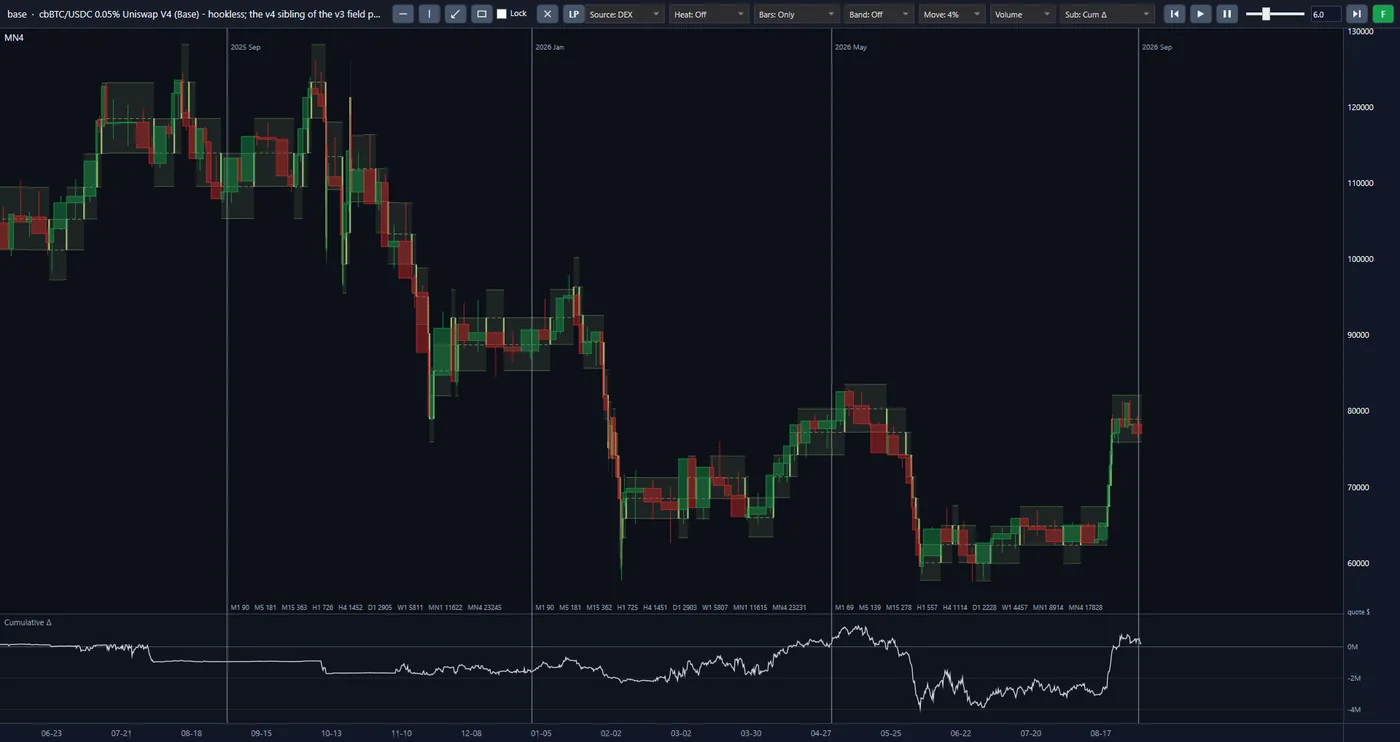
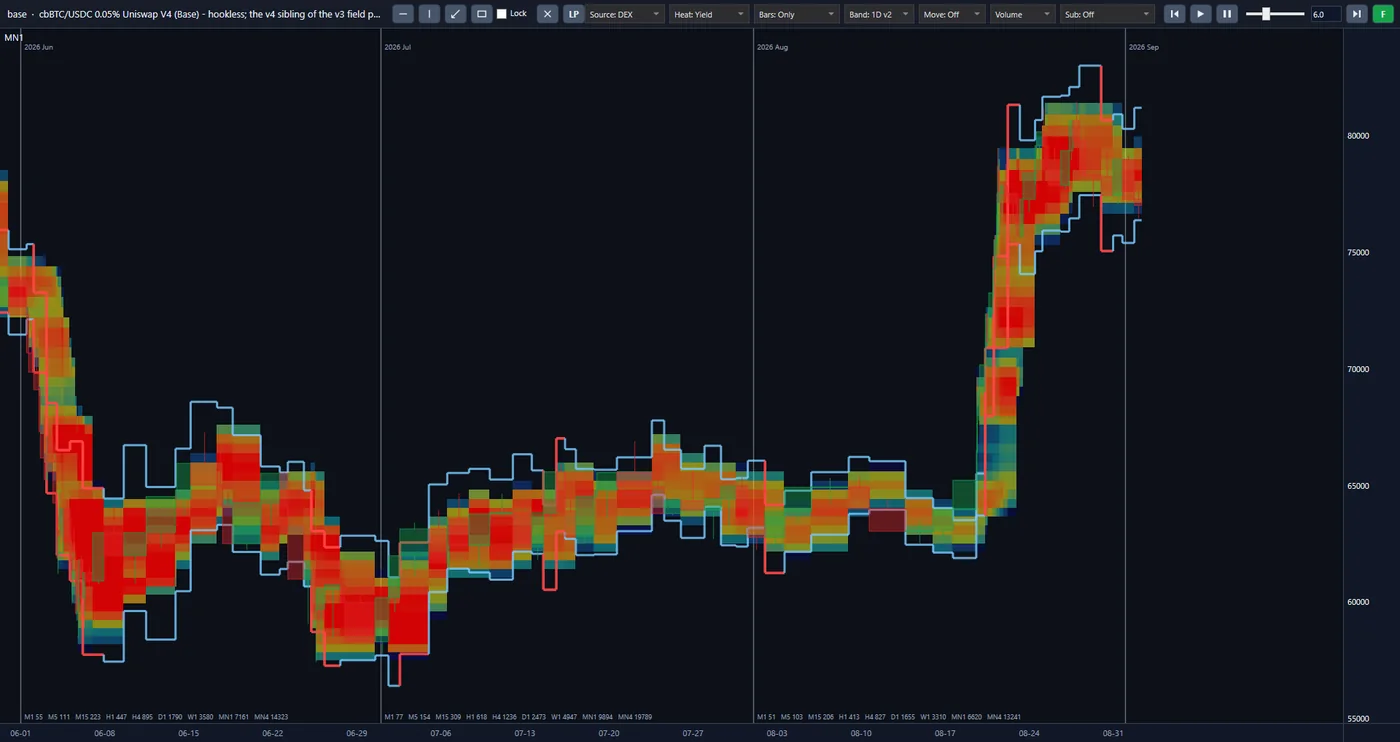
These are real screens from the project's platform, not mock-ups. All three views show one pool: cbBTC/USDC at a 0.05% fee on Uniswap V4, on the Base network. Click the image to enlarge it.
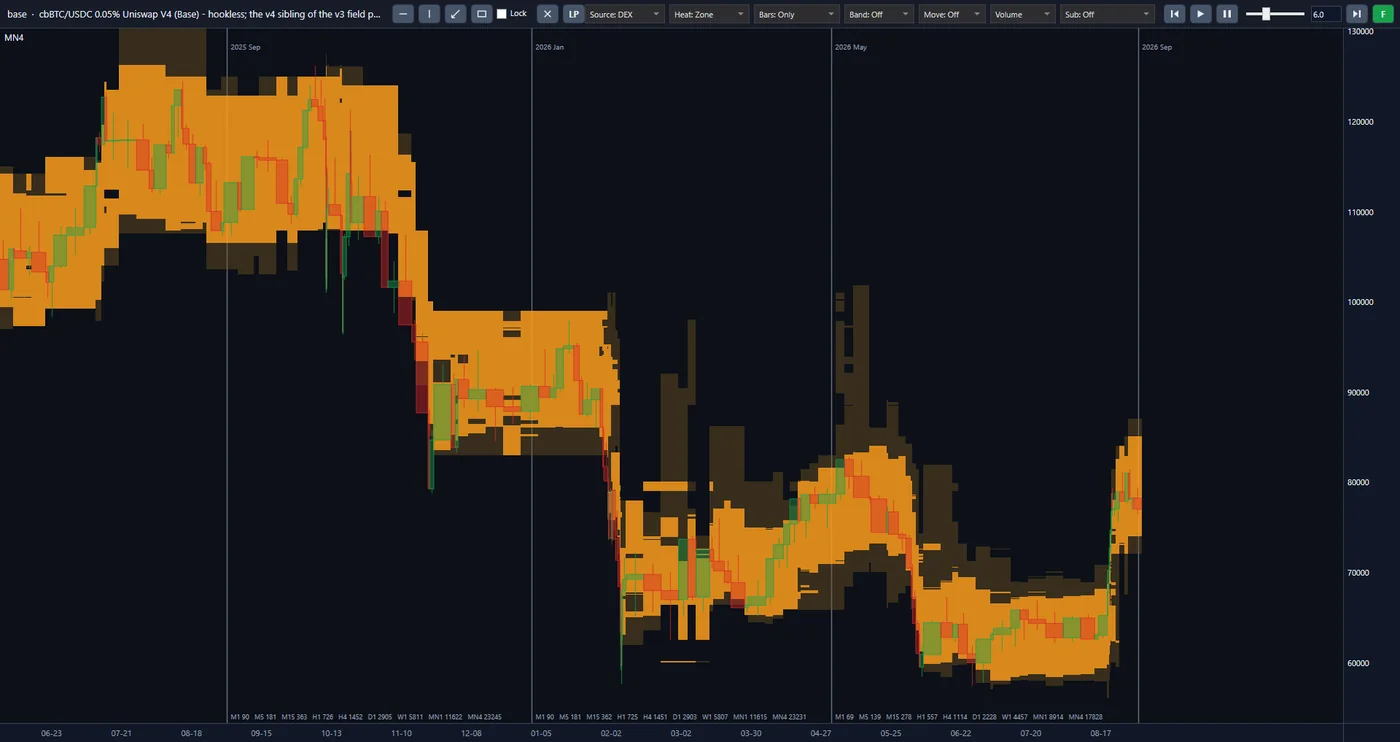
The pool's price bars from June 2025 to August 2026, and around them the Zone heat view: coloured zones across the price levels.
The same bars with the 4% move boxes, and beneath them the cumulative delta panel in dollars.
The last three months in the Yield heat view, with the daily band (Band: 1D) around the price.
Approach
Money sits where its net account is better, and moves when that account changes. The work proceeds in three stages:
-
From raw data to the full picture of the pool
A pool's dashboard shows only price and traded volume. We process every event recorded on the chain and rebuild the pool's state for each moment. The result is a picture of how much capital sat at each price level, and when it came or went.
-
From the picture of the pool to measuring each pool
Our simulator places a hypothetical sum in that same rebuilt pool and works out what fee it would have earned and how much of it the price move would have taken back. The output is a net, comparable figure for each pool. All pools are measured by one yardstick.
-
From measuring the pools to managing money
Putting those figures side by side, the algorithm makes three decisions: which pools the money sits in, over what price range in each, and when it moves from one to another. This stage is under study today.
What stands out
-
Capital that does not stay in one place.
Opportunity moves in this market, and capital that stands still misses it. A pool can have trades today while capital has been leaving it for months; we have seen and recorded a real case of this in our data. The algorithm compares all the pools it watches continuously, not once on the first day.
-
A move that earns back its cost.
Every move has a cost: the transaction fee and the price difference on the way out and in. Chasing every higher rate spends the profit on those costs. In our measurement the cost of moving is part of the account, and a move that does not make it back is not made.
-
Net profit, not the advertised rate.
The rate on a pool's dashboard shows only the fee. What we report is the fee after the loss from the price move, the transaction cost and the price difference on entry. Each part is shown separately, so it is clear where the profit came from and where it went.
-
A simulation checked against real money.
Many calculations in this market are right on paper and not in practice. We have compared the fee the simulator works out with the fee that about 44,000 real positions in six pools collected from the chain. The total difference in the worst pool is under a tenth of a percent.
-
Data reconciled with the chain itself.
Comparing pools on incomplete data leads to a wrong decision, and incomplete data does not announce itself. For all 136 pools the archived events have been compared with the chain, and a health certificate has been issued for each pool. Five kinds of pool on four networks are measured by one engine.
-
Capital in the pool with no intermediary.
Some of this market's losses came not from the market itself but from intermediary contracts that held other people's capital. In our design the capital will sit in the pool directly and in its owner's name. The algorithm will only decide where it goes.
The road ahead
-
Done
The data infrastructure, pool reconstruction for all five kinds, the capital simulator and the reporting system are built and tested.
-
Done
The rules for placing and moving capital have been measured on pools that behave differently; we have not yet declared any strategy final.
-
Now
Completing the pool screening, testing the chosen strategy on unseen periods, and rewriting the system for operational use.
-
Final step
The final step is connecting to live data and managing real money, as an automated fund.
Technology
Data preparation is written in Python, and the analysis engine and simulator in C#. The archive of 136 pools is kept in more than six thousand files, and the server copy is identical to the backup copy file by file. A change is accepted only after it has passed more than 450 automated tests.